Void Clustering and Hierarchy
Back to research
What are voids?
Great question. Cosmic voids are vast regions of space that contain very few galaxies or other cosmic structures. These regions are much larger and emptier than the regions containing galaxy clusters, and are found between the filaments and walls of the cosmic web. Voids play an important role in the evolution and growth of large-scale structures. They provide a "lab setting" to study isolated structure growth, for example in galaxies, as well as dark energy.
In addition, the way matter flows away from the center of the void can help us constrain cosmological parameters, like the matter and dark energy densities.
What Shape Are Voids?
Another great question. Despite the general definition of voids given above, they are not actually yet well-defined. The main accepted answer is they are generally ellipsoidal, and tend to be more spherical as they increase in size. However, this ignores the details, and there are a lot more questions that have yet to be answered:
- At what point is the region's density low enough to be considered a void?
- How small can voids get?
- What constitutes the boundary of a void?
- Where is the center of a void?
- Can voids cluster in the same way galaxies can?
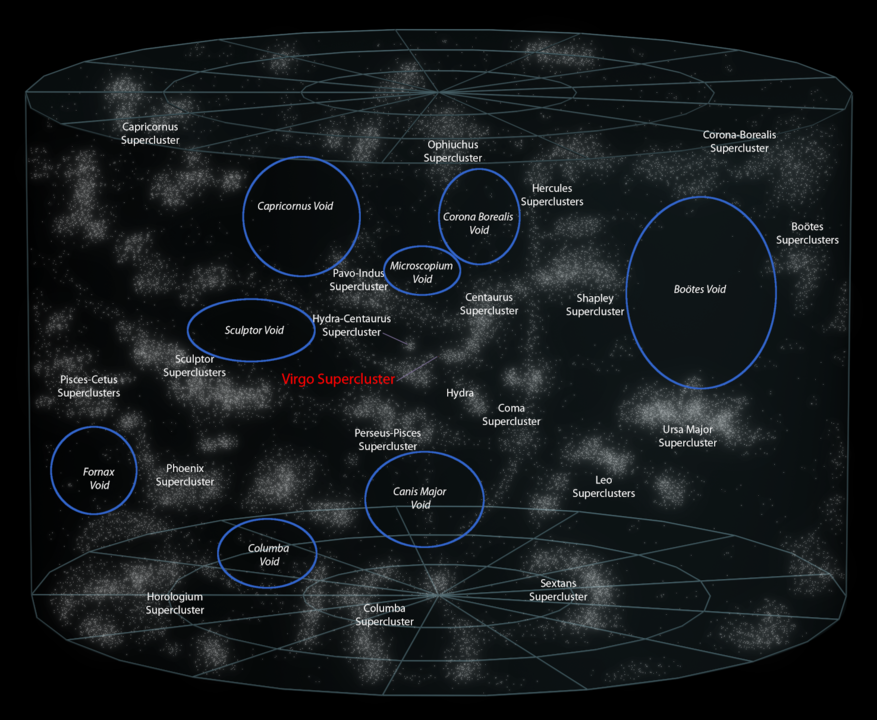
Fig. 1: Chart of the voids near the Milky Way
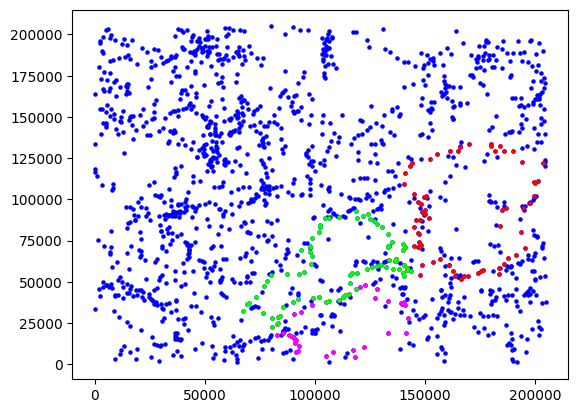
Fig. 2: Three voids found with persistent homology
Void Centroids
In order to answer the questions, we must start by asking: where are the centroids of these voids?
Figure 3 shows an annulus of points, where we can clearly and easily identify the center at the origin.
It has a clear symmetry, and its randomly scattered points average out to the coordinate (0, 0).
However, data may not always be so abundant, nor have such a symmetrical distribution.
For instance, it may look like figure 4, which has many more points on the left side than the right.
A human eye may be able to trace the shape, connect the dots, and point to a rough center, ignoring the imbalance of data.
But, taking an average of the coordinates will clearly skew the centroid to the left.
How do we tell a computer where to find the true, visual centroid?
Furthermore, what about generalizing it to any shape and not just circles and ellipses?
My solution is to introduce Delaunay triangulation, a specific type of triangulation, or an algorithm that connects the dots in such a way to form unique, non-overlapping triangles.
The triangulation of the imbalanced ring is shown in figure 5.
Given this, I can calculate the centroids of each triangle using a basic average of its vertices.
I can also find each triangle's area by a well-known formula in coordinate geometry.
Finally, I take an average of those centroids weighted by their corresponding areas, and I get the centroid I wanted.
It makes sense to think of this as the centroids that weighed more contribute more because they represent a larger area in the interior of the shape.
In the figure, the red point is the center of the circle while purple is the calculated centroid of the circumscribed points.
Pretty good!
Let's try this on a few other cases.
Figure 6 is a much more sparse set of points translated off the origin, and the algorithm still works beautifully!
There is a little bit of a shift from the red dot, but in fact for such a low number of points, the purple dot is more representative of the centroid anyways.
Figure 7 is two ovelapping imbalanced rings, and it works just as well as any other test case.
The black dots help visualize the centroids of each triangle, and the corresponding area weights.
I could keep going and trying other cases, but I think this current algorithm is sufficient for the purposes of my project.
It is fast, intuitive, and gives the desired results.
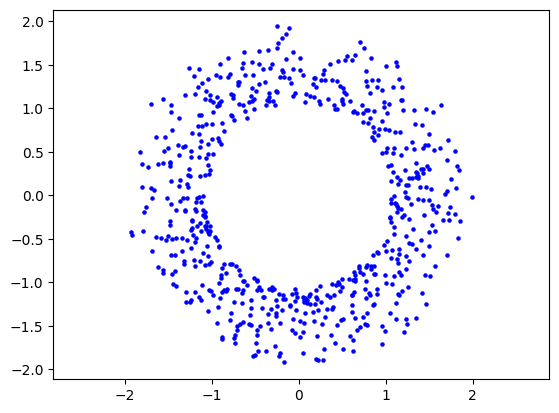
Fig. 3: A constructed annulus test case
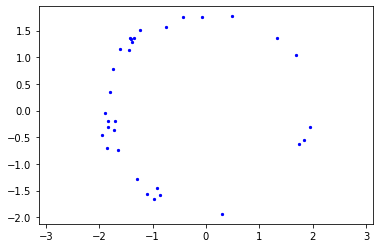
Fig. 4: An imbalanced ring
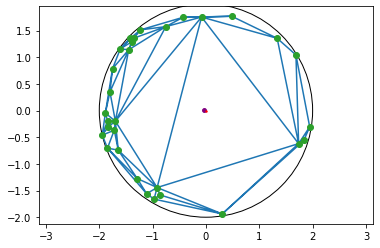
Fig. 5: Delaunay triangulation of the imbalanced ring
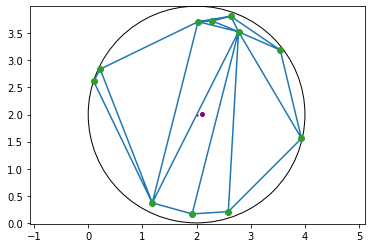
Fig. 6: Shifted, sparse, imbalanced ring
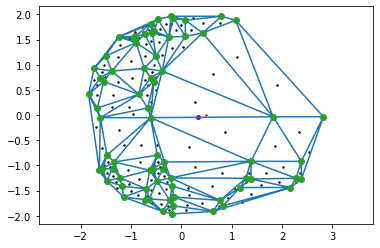
Fig. 7: Overlapping imbalanced rings
Okay, this is looking great. But what about the fact that space is (at least) three dimensions? Luckily, this technique can indeed be generalized to higher dimensions. Instead of triangles, I can use tetrahedra, their centroids, and their volumes as weights for the centroids.
Applying this method of calculating the centroids to the voids from earlier, we can see in figure 8 that it does indeed work for abstract shapes as well. The magenta void especially benefits from the technique I developed, as it has a clear imbalance of data points on the top and bottom. However, recall that this is a thin slice of the simulation, and I am only tracing the one-dimensional loops with persistent homology. This means we can do better, and identify 2-dimensional holes instead.
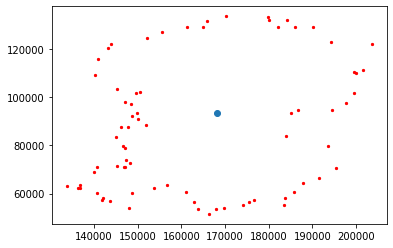
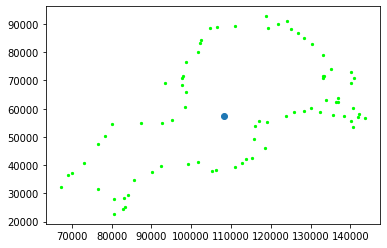
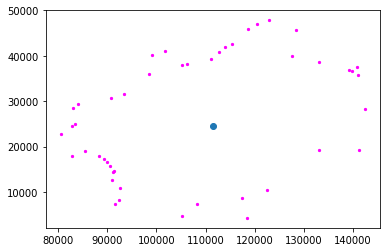
Fig. 8: Three loops detected by persistent homology with their centroids
Void Statistics
[In progress]
Fig. 9: Sample voids detected with persistent homology and fitted to ellipsoids using inertia tensors